Temperature Mapping and Thermal Validation That Holds Up
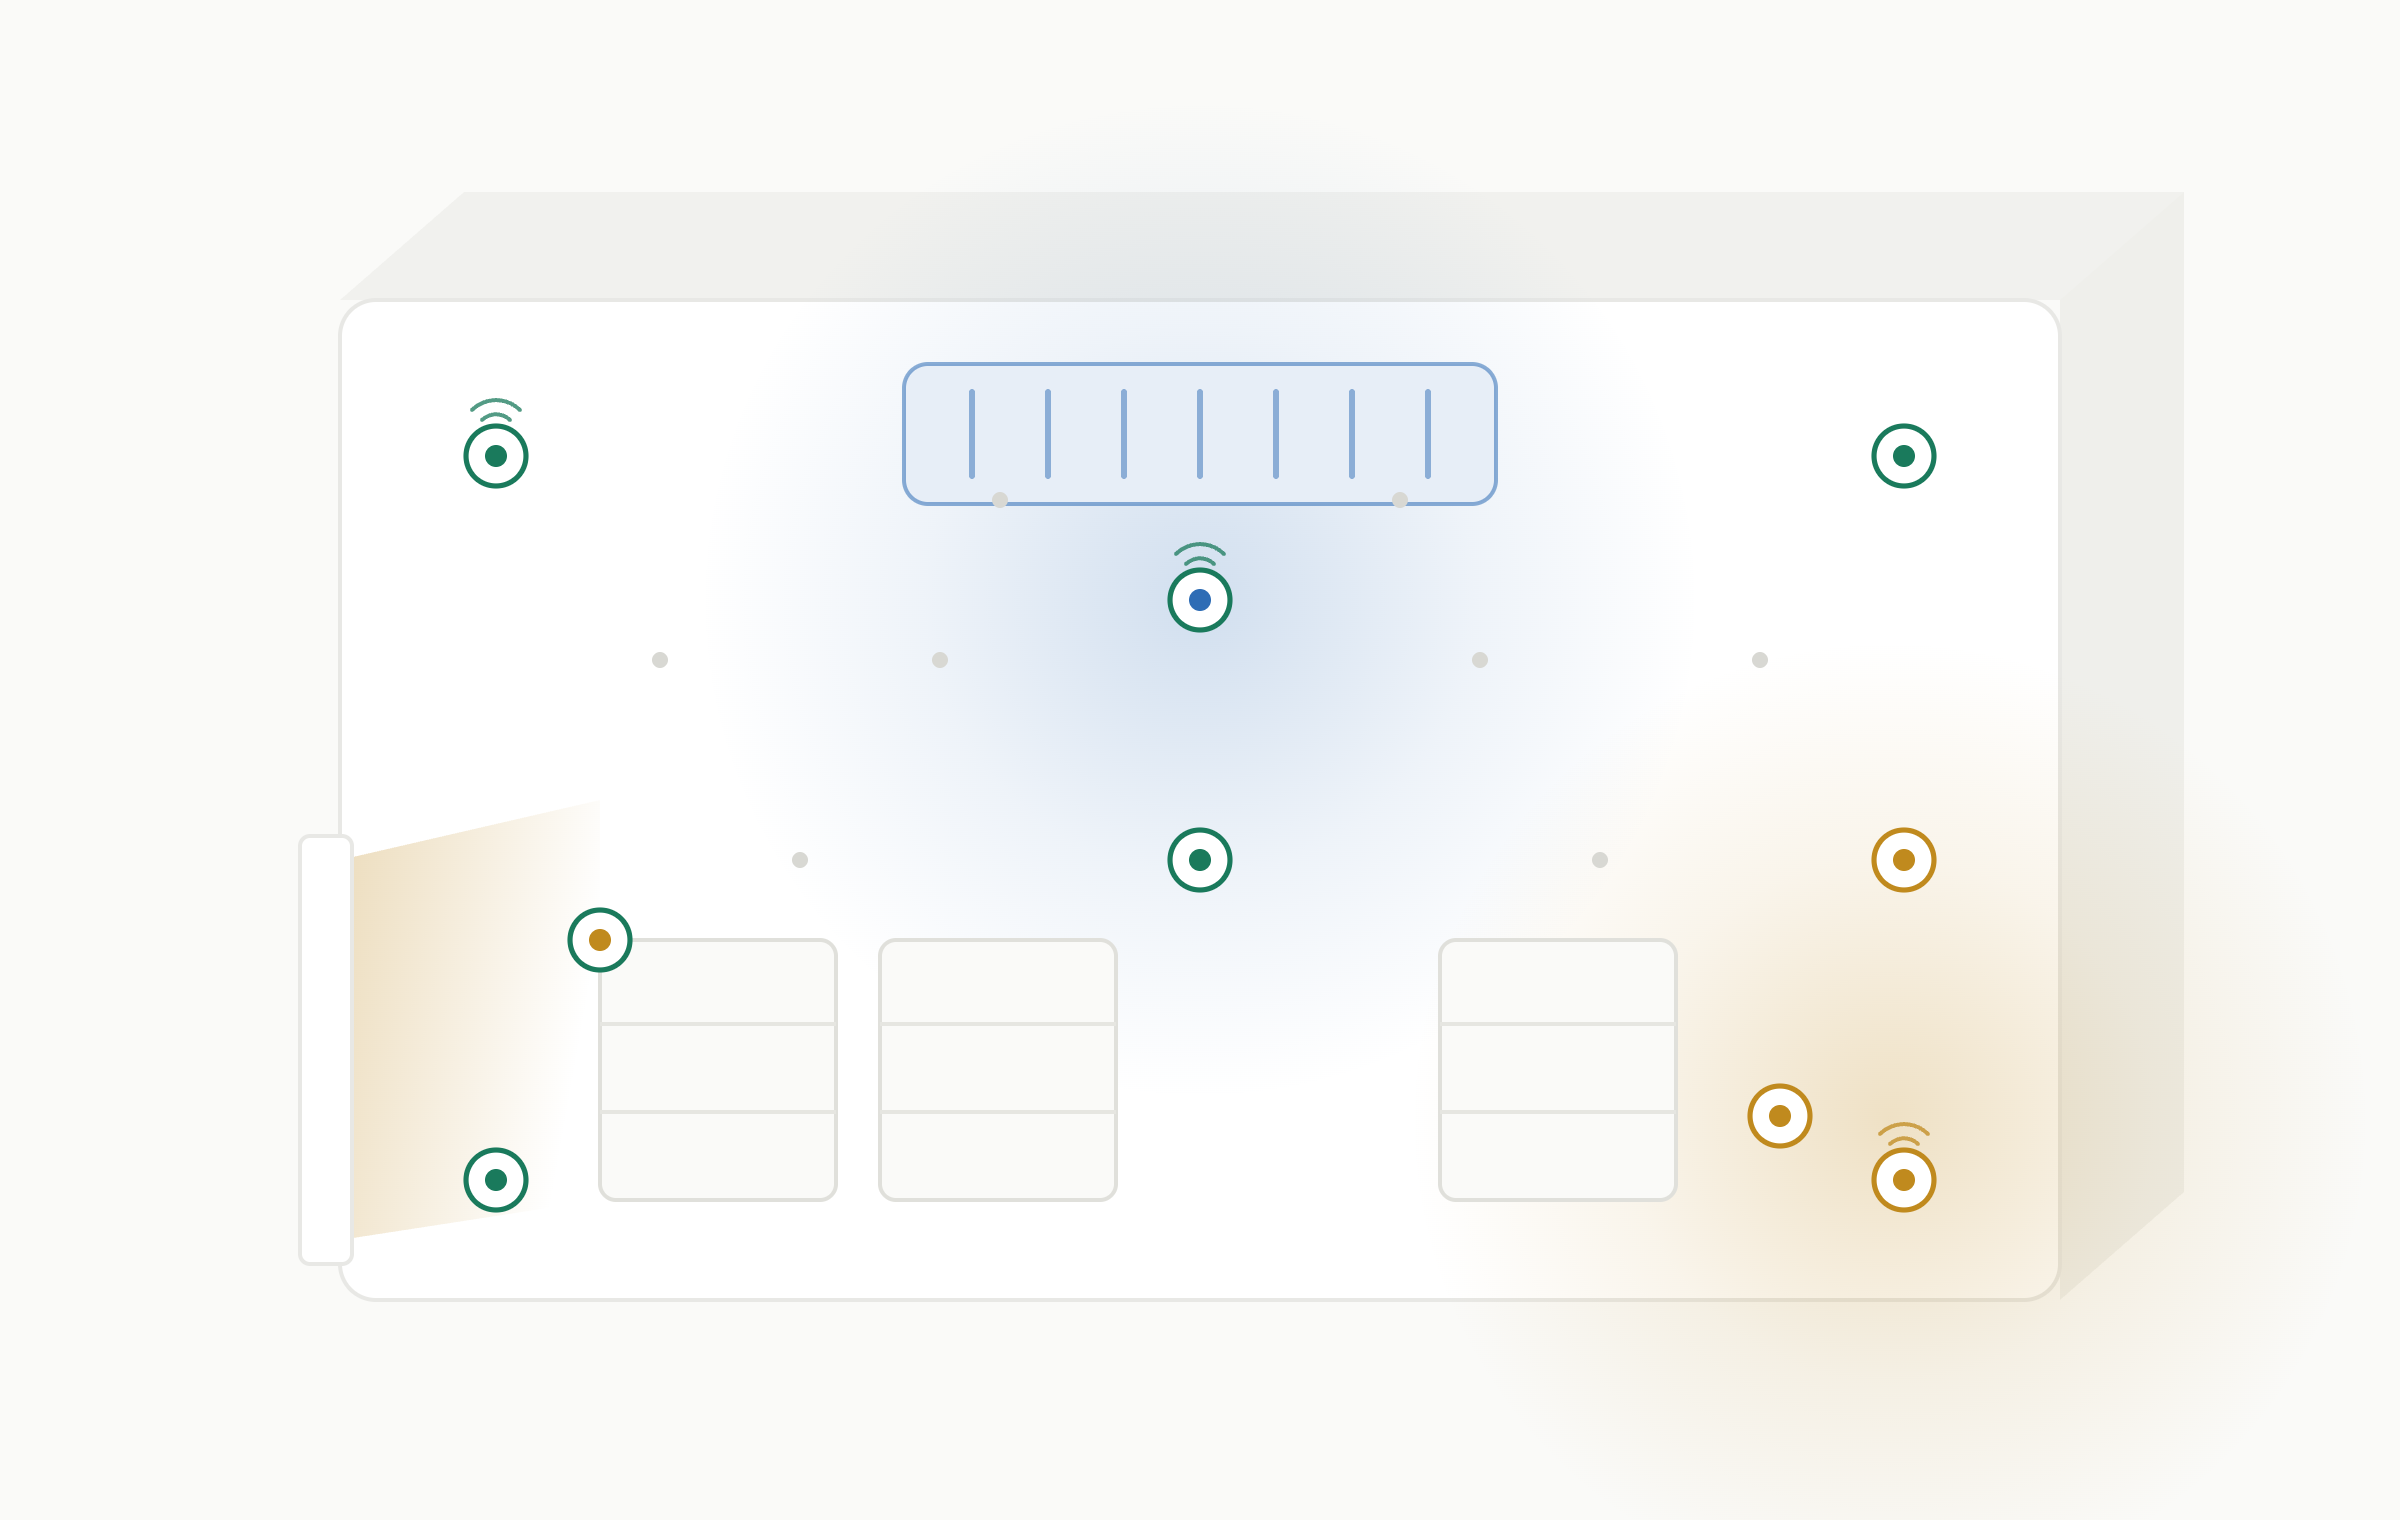
A cold room reads 5 degrees on the panel by the door, and everyone assumes the whole room is at 5 degrees. It is not. The corner behind the top shelf near the evaporator runs colder, the spot by the door runs warmer every time someone walks in, and the pallet stacked against the external wall in July sees something the wall-mounted probe never reports. Temperature mapping is how you find those places before an auditor, a stability failure, or a rejected batch finds them for you.
This guide is for the engineer or quality lead who owns thermal qualification of a controlled space or piece of equipment: a stability chamber, incubator, oven, autoclave, cold room, refrigerator, freezer, warehouse, or shipping lane. It covers how to place sensors to find worst-case locations, why empty and loaded studies answer different questions, how open-door and power-loss studies turn a static picture into operating limits, why warehouses usually need summer and winter data, and how to tie every acceptance criterion back to the product's storage claim. The aim is a study that survives scrutiny, not a folder of numbers with no rationale for why those sensors, that duration, or that load.
Caption: A mapping study positions calibrated loggers to find the extremes, not to confirm the center.
What temperature mapping actually demonstrates
Temperature mapping is documented evidence that every location a product can occupy inside a controlled space stays within its required range under realistic operating conditions. The operative idea is spatial distribution. A control system regulates temperature at its sensor, but the air, the walls, the load, and the door all create gradients, so the temperature the product experiences depends on where it sits. Mapping measures that distribution with an array of sensors and identifies the warmest and coldest points, called hot spots and cold spots.
Those extremes are the point of the exercise. If the worst location in the space holds range, the rest does too, which is why a map built around finding and challenging the extremes is defensible and a map built around a single convenient probe is not. The hot and cold spots also feed the next decision: where to install the permanent monitoring probes that watch the space every day after qualification. Mapping and routine monitoring are two halves of one system. The study finds the worst locations once, and monitoring watches them continuously.
Thermal validation sits inside the same qualification lifecycle as any other equipment. A chamber or cold room is installed and its utilities confirmed, its controls and alarms are exercised, and then its performance is challenged under load. If you want the vocabulary of that lifecycle laid out plainly, see IQ vs OQ vs PQ: what actually goes in each one. Mapping is most naturally the performance-qualification evidence for a controlled space, and the empty study often supports operational qualification of the equipment itself.
The regulatory frame, stated honestly
There is no single global regulation that says "run three mapping studies with nine sensors." What exists is a layered set of predicate regulations, consensus guidance, and industry good-practice documents, and it helps to keep them straight rather than cite any of them as an absolute.
At the top sit the good-practice frameworks that govern controlled storage and equipment qualification. EU GMP Annex 15 sets the expectation that facilities, equipment, and utilities are qualified across a lifecycle and that qualification is risk-based, which is the umbrella under which chamber and cold-room mapping falls. For storage and distribution specifically, the World Health Organization has published detailed model guidance, including a dedicated supplement on temperature mapping of storage areas, that many programs treat as the practical reference for how to design a mapping study. The United States Pharmacopeia addresses the same ground across its chapters on the storage and transportation of drug products and on monitoring devices, it defines the storage conditions themselves, such as controlled room temperature and refrigerated storage, in its packaging and storage requirements chapter, and as of 2024 it added a dedicated general chapter on temperature mapping for the qualification of storage areas.
Below those sit industry guides that translate the expectations into method. Good-practice guidance from technical societies on controlled-temperature-chamber mapping and on cold-chain management describes sensor distribution, study duration, empty and loaded configurations, and excursion studies in operational detail. These are guidance, not law, but a program that follows a recognized guide and documents its rationale is far easier to defend than one that improvises.
The honest framing for any of these is "commonly expected under" rather than "required by." The number of sensors, the duration of a study, and the number of runs are risk-based decisions you justify in a protocol, not fixed quantities handed down by a regulator. Where a specific document does state a value, cite that document rather than attributing the number to an agency that never set it.
Sensor placement: finding the worst case
Everything in a mapping study depends on where the sensors go. The objective is not even coverage for its own sake but deliberate placement to capture the extremes and enough of the interior to characterize the gradient between them.
Start with a distribution grid. Sensors are placed throughout the working volume in a three-dimensional pattern so that the study captures top, middle, and bottom as well as the horizontal spread. Temperature stratifies vertically because warm air rises, so a grid that only samples one height misses the story. On top of the grid, add sensors at the locations you already suspect are worst case. In a cold room or warehouse those are typically near the doors, beside the air handlers and the return and supply diffusers, close to the cooling or heating coils, under lights, against external walls and the roof, and in the geometric corners where circulation is poorest. In a chamber, the worst case is often near the door seal, the corners, and directly in the airflow from the conditioning unit.
The number of sensors follows from geometry and risk, not from a memorized figure. A domestic-scale refrigerator needs far fewer than a multi-bay warehouse. Larger volumes, more complex geometry, more potential hot and cold spots, and more critical product all push the count up. The defensible move is to state the volume, sketch the grid, list the suspected worst-case locations, and justify the total in the protocol. A study that copies a sensor count from an unrelated space and cannot explain it is the study that draws a finding.
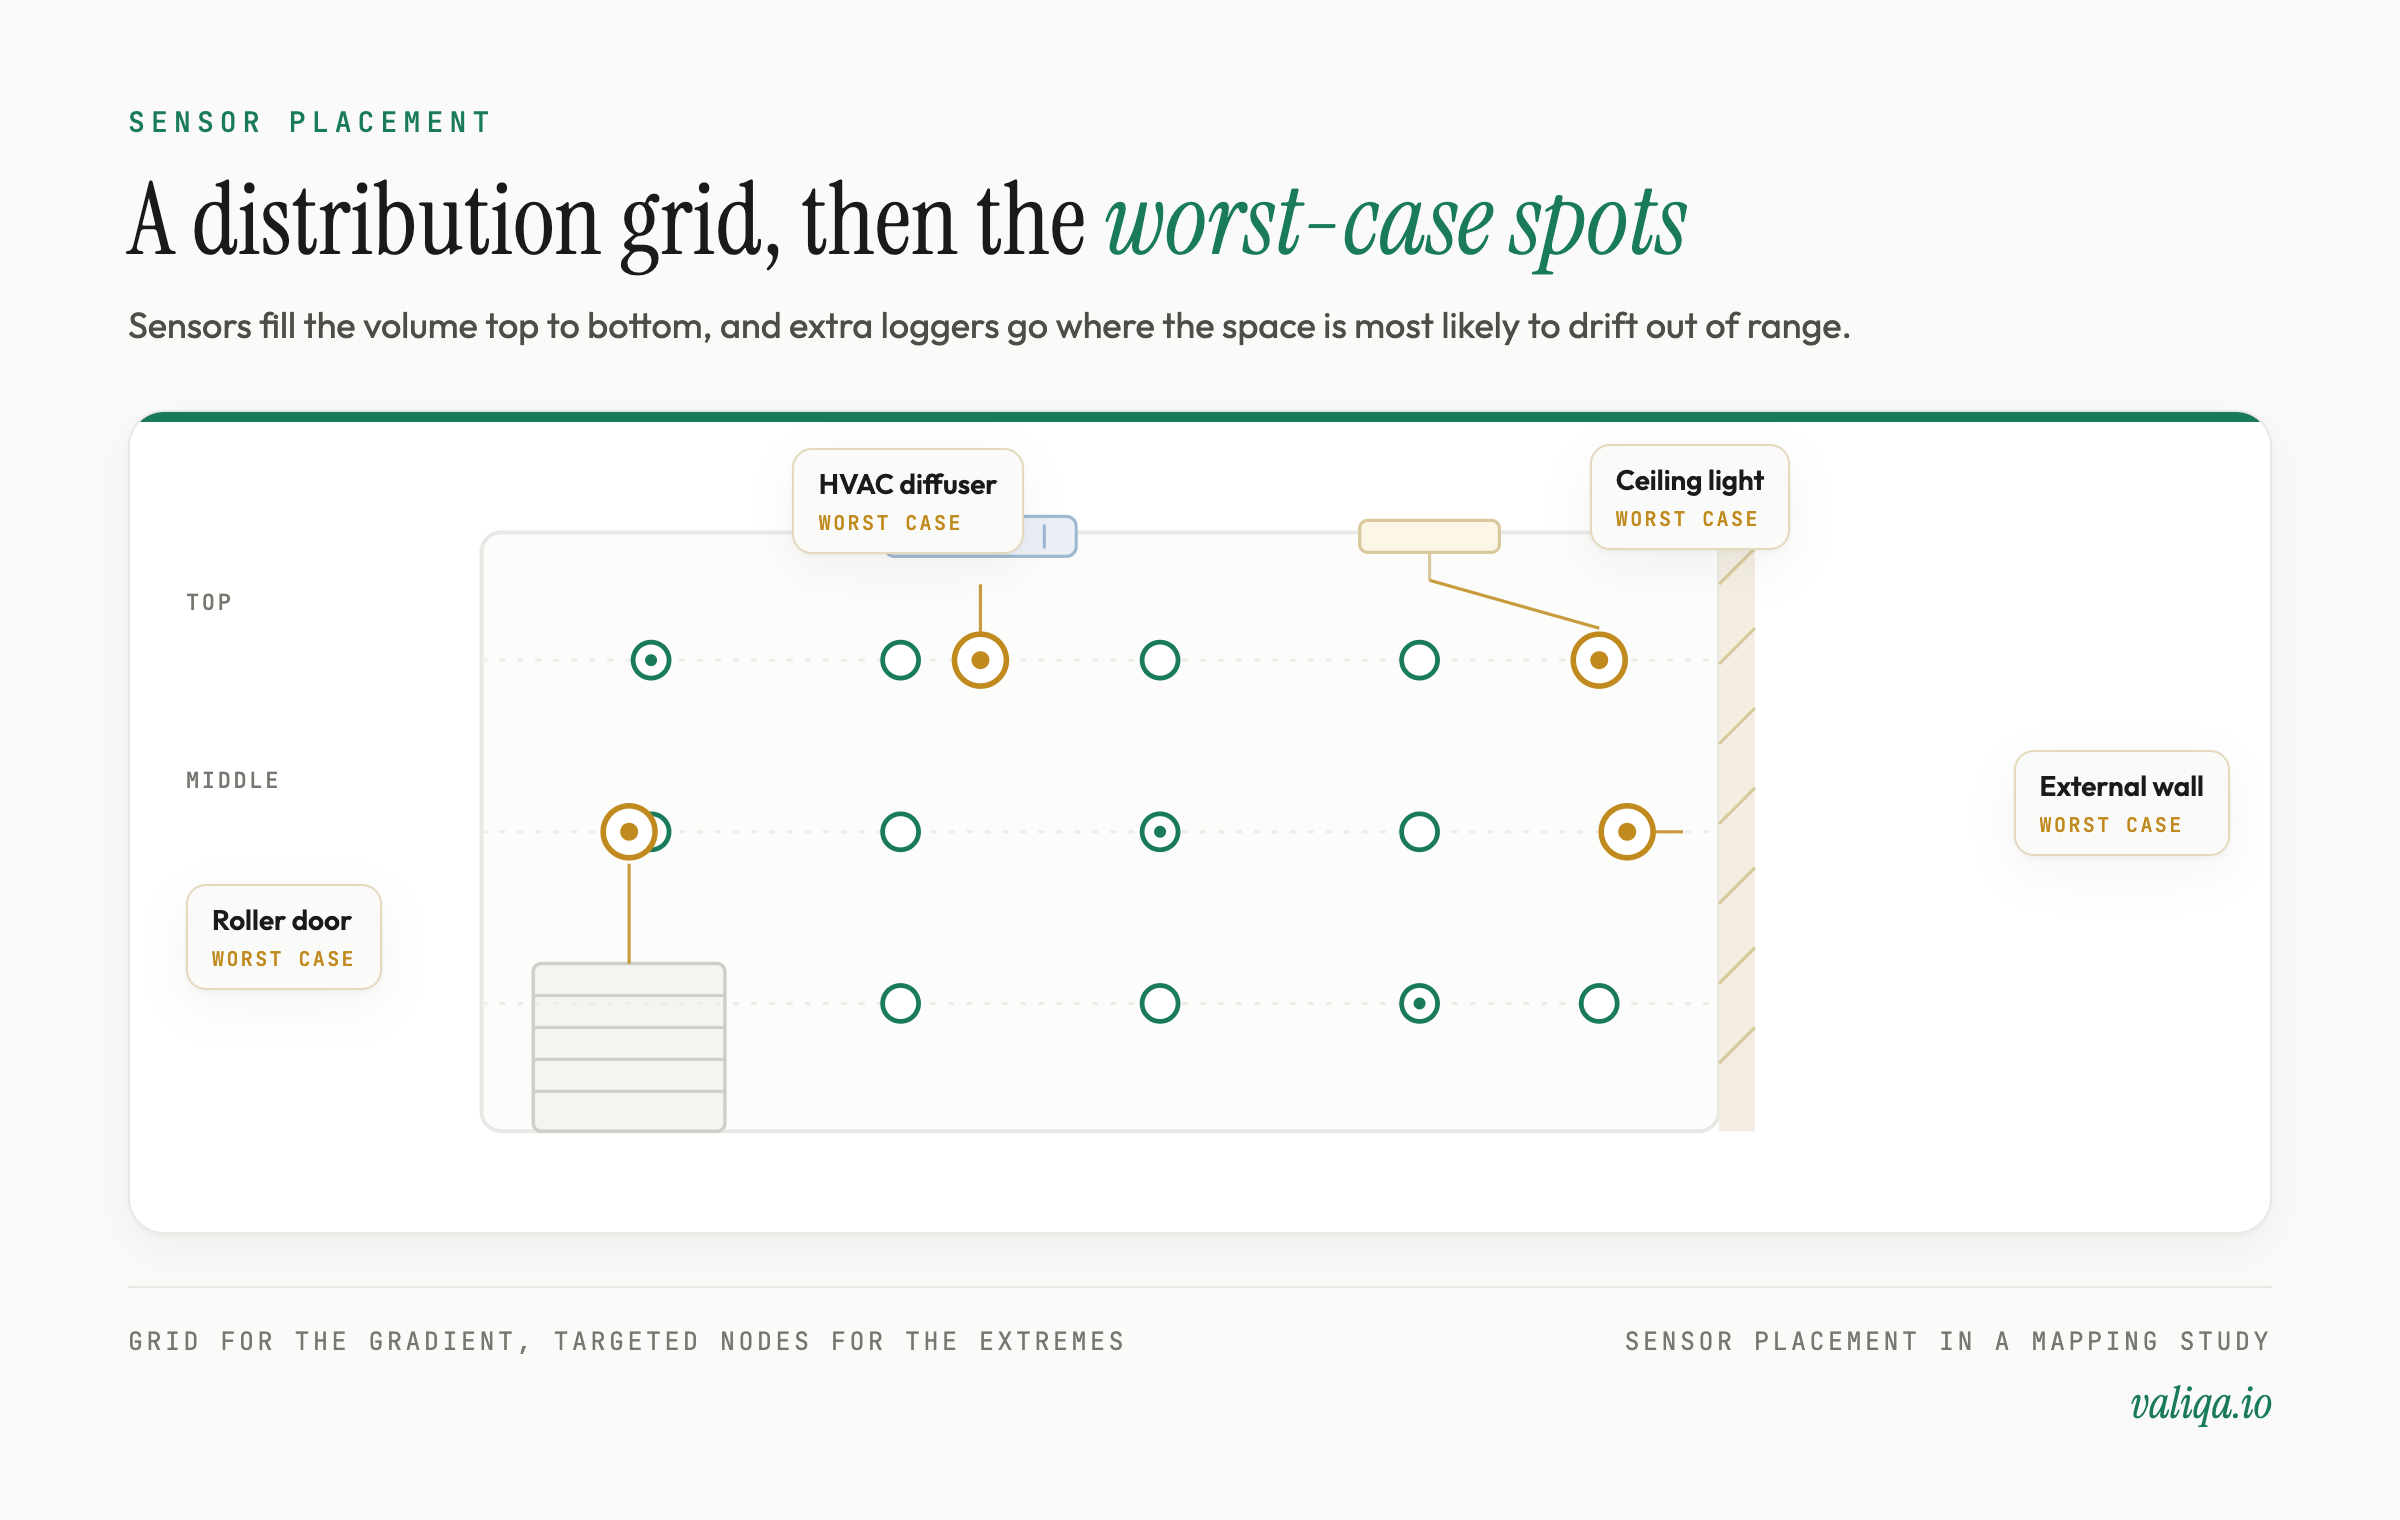
Caption: A distribution grid captures the gradient; targeted sensors at doors, diffusers, walls, and lights capture the extremes.
Every sensor also needs an identity and a home. Each logger is uniquely numbered, its exact position recorded on a map or drawing so the study is reproducible, and its reading tied to that location in the report. When a hot or cold spot shows up, you have to be able to point to precisely where it was.
Empty versus loaded: two studies, two questions
An empty space and a loaded space behave differently, and the two configurations answer different questions.
An empty study characterizes the equipment and the air distribution with nothing inside. It isolates the behavior of the control system, the fans, and the conditioning unit, giving a clean baseline for how the space performs on its own. This is the natural companion to operational qualification, because it shows the equipment can achieve and hold the target across the volume before any product complicates the picture.
A loaded study repeats the mapping with the space filled to its intended configuration. Product has mass and packaging, and stacked goods block and redirect airflow, so loading routinely creates new cold or warm pockets that the empty study never revealed. A pallet pushed tight against a wall, a densely packed shelf that starves the back row of circulation, a stack that sits directly under a supply diffuser: these are the situations the loaded study exists to catch. The loaded configuration should represent the worst case for airflow, which usually means maximum fill or the stacking pattern that most restricts circulation, not a half-empty convenience arrangement.
Running both is common and sensible. The empty study qualifies the box, and the loaded study confirms it still holds range when it is doing its actual job. Where a program runs only one, it should justify which and why, because an empty-only study says nothing about airflow under load and a loaded-only study cannot separate an equipment problem from a loading problem.
Duration and the studies that create operating limits
A mapping study has to run long enough to capture how the space actually behaves over time, not just a snapshot at one moment. For a storage area that means covering the normal operating cycles, including daily temperature swings and the rhythm of a working week with its door openings and traffic. Guidance for storage areas frames the duration as a risk-based decision, long enough to represent normal operating conditions rather than a fixed number of hours, and in practice many teams run a continuous study ranging from about 48 hours to a full working week that captures the daily and weekly cycle. For a chamber or smaller equipment, mapping over one or more complete control cycles once the space has stabilized may be sufficient. The right duration is the one you can justify from the dynamics of the specific space, and that justification belongs in the protocol.
Two dynamic studies turn a static map into rules people can follow.
The open-door study measures what happens when a door is opened, held open, or opened repeatedly, which is exactly what happens in real use. It records how quickly temperature drifts out of range near the opening and how long the space takes to recover once the door closes. From that data you can set a defensible limit on how long a door may stay open and how many openings the space tolerates before recovery is at risk. Without this study, a door-open limit is a guess.
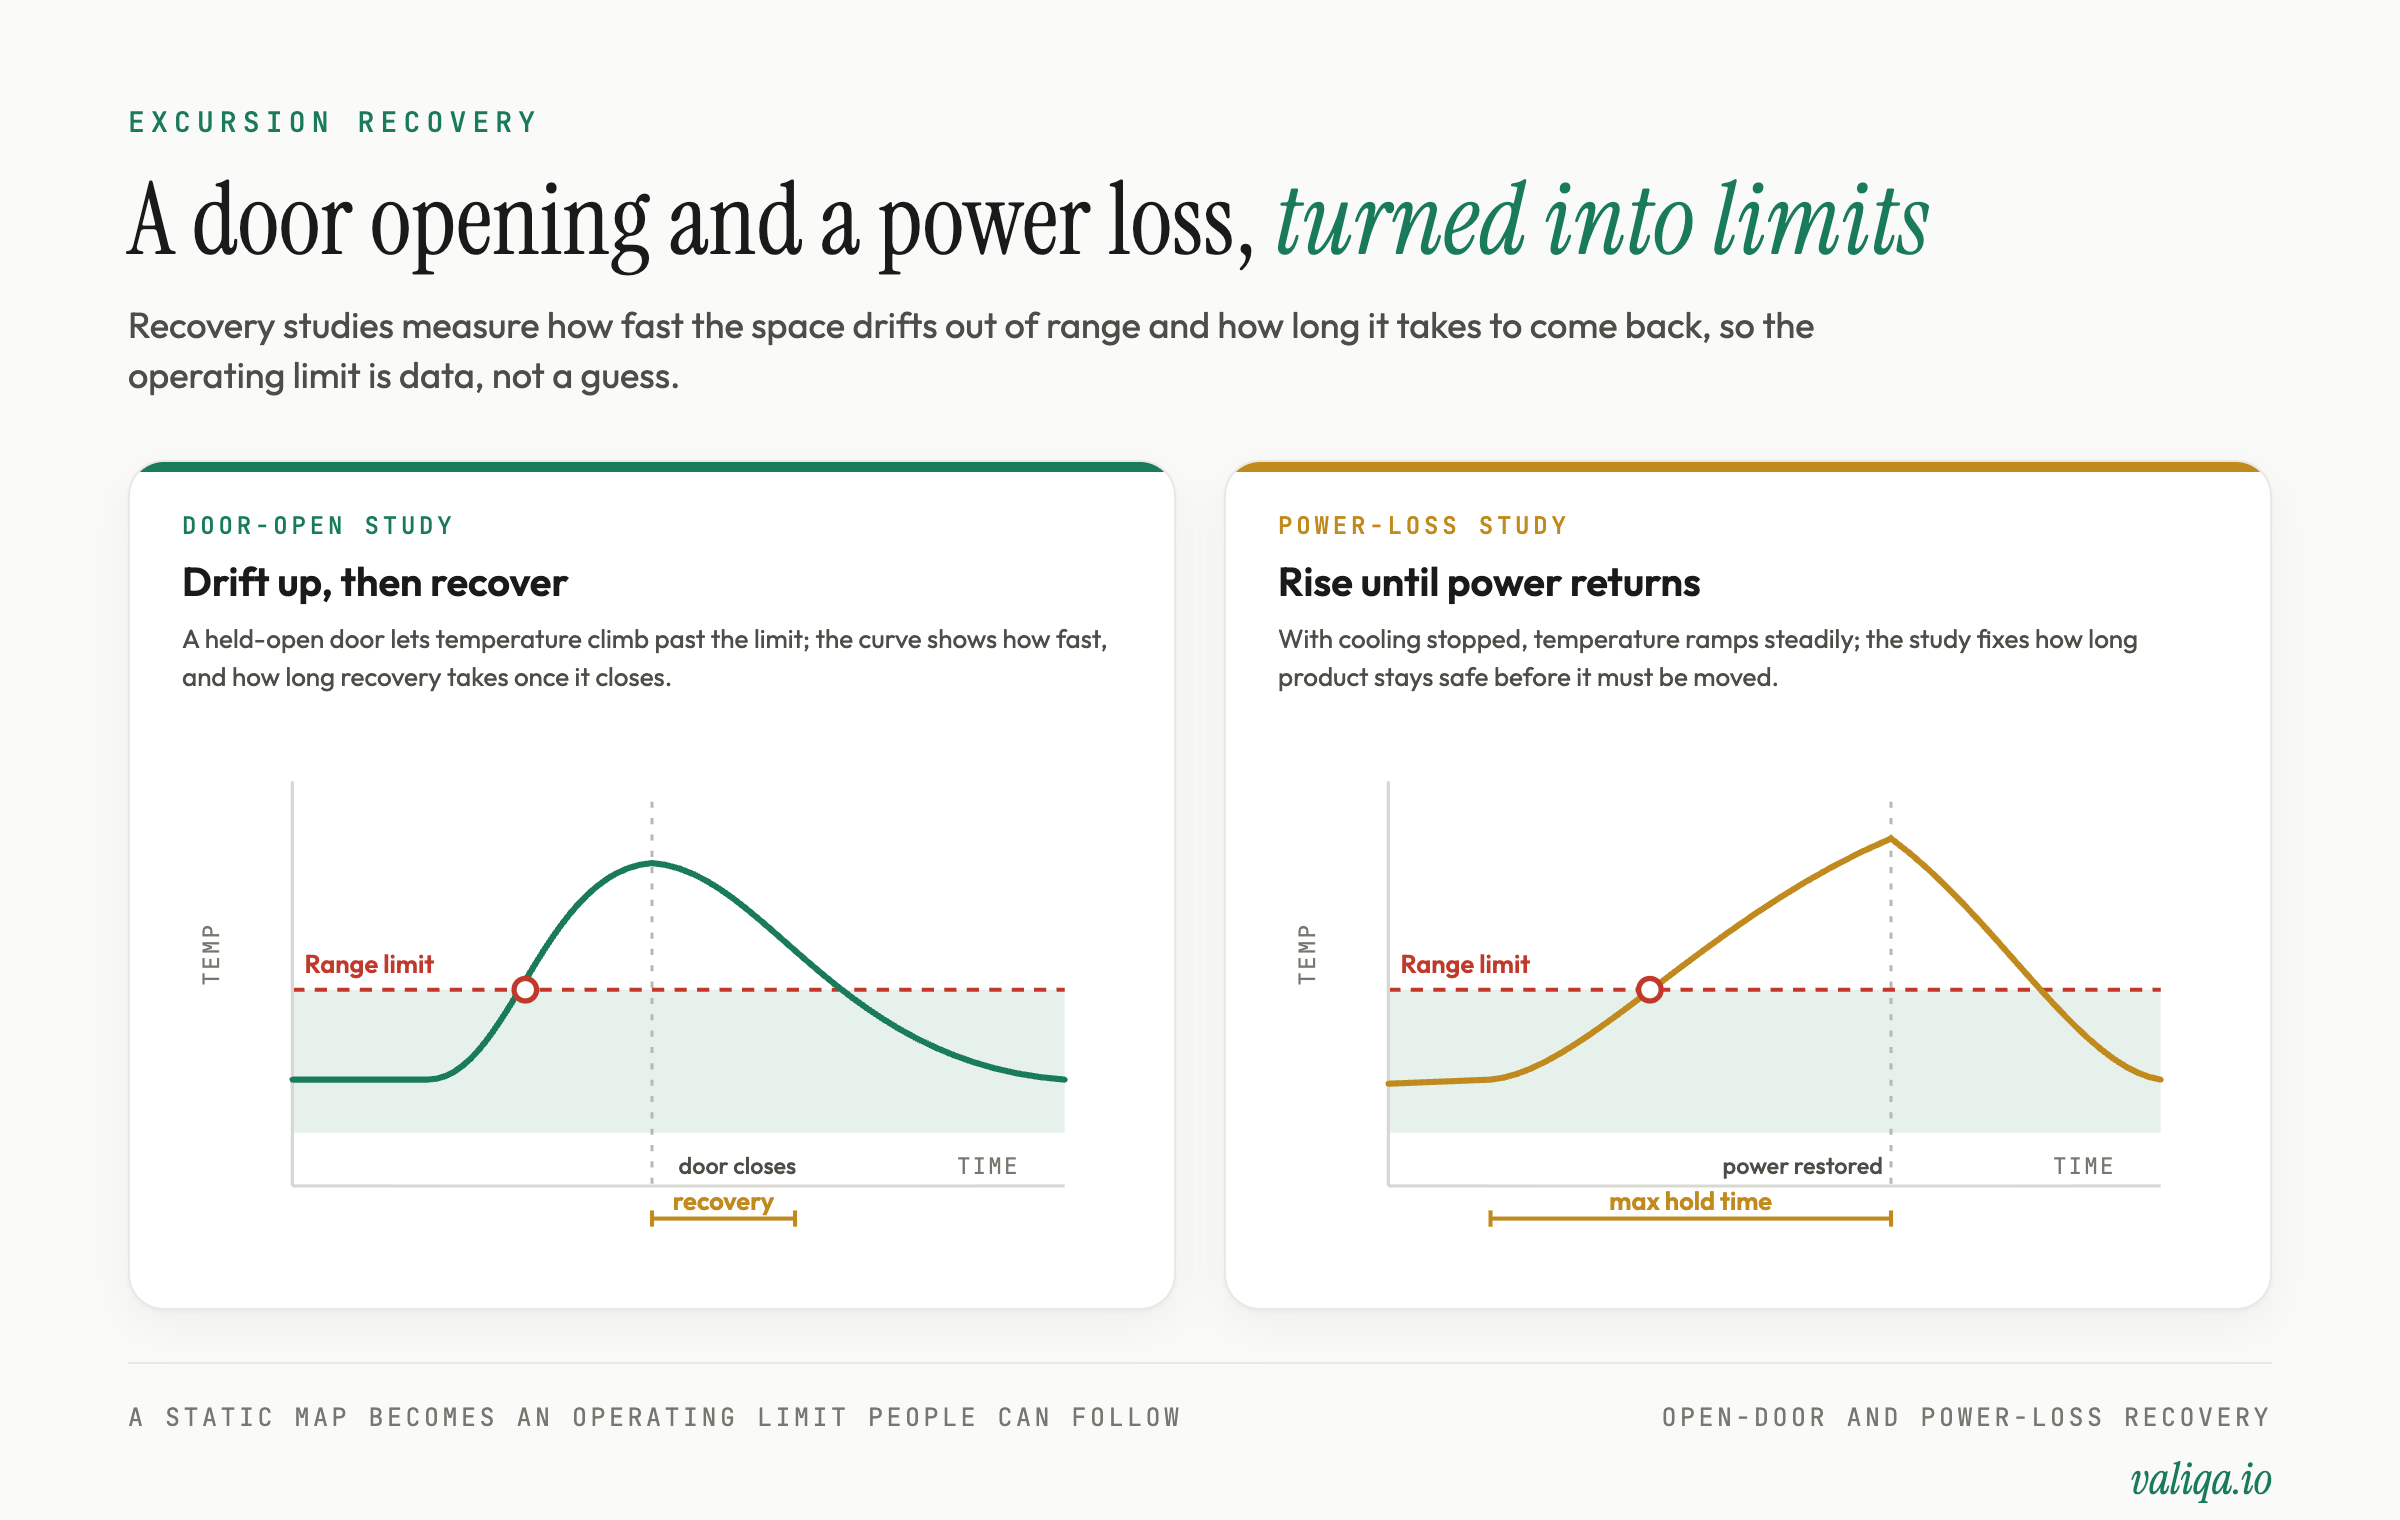
Caption: Recovery curves turn a door opening or a power loss into a defensible time limit.
The power-loss or excursion-recovery study measures how the space behaves when cooling or heating stops, whether from a planned interruption or a simulated failure. It answers the question every quality system needs answered: if the power fails, how long does product stay safe, and how long may it remain before it must be moved. That result becomes the maximum excursion time your standard operating procedures rely on. For freezers and cold rooms holding critical product, this study is often the difference between a calm, documented response to an outage and a panicked disposition decision with no data behind it. For ultra-low storage specifically, whether a -80C freezer needs a PQ covers how the loaded power-loss study fits into the wider qualification scope.
Seasonal mapping for warehouses and ambient-dependent spaces
A controlled space whose performance depends on the ambient environment does not behave the same in July as in January. The load on the cooling or heating system shifts with outside temperature, and the worst-case locations can move with the season. A spot near an external wall or a roof that holds range in mild weather can climb out of range during a heat wave, while a bay near a loading dock or a poorly sealed door can drop too low in a cold snap.
For that reason, seasonal mapping is widely expected for temperature-controlled storage areas, particularly larger warehouses where ambient influence is strong. The usual approach is to map the extreme conditions, summer and winter, so the study brackets the worst case the space will face across the year. An alternative is to map once and justify with data that a single study bounds the extremes, but that argument has to be supported, not assumed. After qualification, continuous routine monitoring at the mapped worst-case locations confirms that the seasonal conclusions still hold and flags any drift as conditions change.
Smaller, tightly controlled equipment such as a stability chamber or an incubator in a conditioned room is far less sensitive to season, so the seasonal question is really about how much the space depends on ambient conditions. The more exposed the space, the stronger the case for capturing both extremes.
Mean kinetic temperature, where it belongs
Mean kinetic temperature, or MKT, is a single calculated value that represents the cumulative thermal stress of a series of varying temperatures over time. Because chemical degradation accelerates with heat in a nonlinear way, MKT weights higher temperatures more heavily than a simple average would, so it captures the real impact of warm excursions better than an arithmetic mean. It is computed from monitoring data using a defined activation energy, with a value of about 83 kilojoules per mole commonly used as a default when a compound-specific value is not available.
MKT belongs mainly in storage and distribution of temperature-sensitive product. Its practical use is to evaluate whether a period that included brief excursions above the labeled range still represents acceptable cumulative exposure, so that a short warm spell does not automatically condemn product if the overall thermal stress stayed within the allowed condition. That is a legitimate and useful tool.
What MKT is not is a license to ignore excursions or to paper over a space that cannot hold range. Where a storage condition specifies instantaneous limits or where a product is intolerant of any excursion, meeting those limits comes first, and MKT does not override them. It is a way to interpret a compliant monitoring record, not a way to rescue a noncompliant one.
Calibrated sensors and the credibility of the data
The entire study rests on the sensors, so their calibration is not a footnote. Each data logger or probe used in the mapping should be calibrated against a reference standard traceable to a national metrology institute, and the calibration points should bracket the target storage range so accuracy is established where it matters. A logger calibrated only at room temperature is not qualified to certify a minus-20 freezer.
Calibration happens twice. Before the study, calibration establishes that each sensor is accurate. After the study, a post-study verification confirms the sensor did not drift during the run. That closing check is what protects the data, because a sensor that reads correctly before but has drifted out of tolerance by the end casts doubt on everything it recorded in between, and the pre-and-post bracket lets you defend the readings or quarantine them. The measurement uncertainty of the sensors also matters when a mapped value sits close to an acceptance limit, and the calibration status and uncertainty of every sensor should appear in the report.
Acceptance criteria that trace to the product
Acceptance criteria are where many mapping studies quietly fail, not because the space performed badly but because the criteria were vague. A criterion such as "temperature around the target" cannot be judged pass or fail, and an inspector will treat it as no criterion at all.
Sound criteria trace back through a short chain. The product has a storage condition, that condition comes from stability data and appears on the label, and the mapping criteria enforce that condition at every location. If the product is labeled for 2 to 8 degrees Celsius, the criterion is that all mapped locations remain within 2 to 8 degrees for the study duration, with any excursion assessed against the product's demonstrated tolerance rather than waved through. Criteria commonly also address uniformity, meaning the spread between the warmest and coldest locations, and the recovery behavior captured in the open-door and power-loss studies, such as a maximum acceptable door-open drift or a maximum recovery time.
Writing these so they hold up is its own skill, and the same discipline that keeps any acceptance criterion out of trouble applies here. For the general method, see how to write acceptance criteria that will not get flagged in an audit. Every limit should be specific, measurable, and justified against the product requirement, so that the study produces a clear verdict and a clear rationale for it.
From map to monitoring, and when to re-map
The study is not the end of thermal control, it is the setup for it. The hot and cold spots the mapping identified are precisely where the permanent monitoring probes should live, so that everyday monitoring watches the locations most likely to breach the limit rather than a spot chosen for wiring convenience near the door. Installing monitoring probes without a mapping study to justify their placement is a recognized gap, because it leaves the riskiest locations unwatched. The map earns its keep by pointing monitoring at the right places.
Re-mapping is a change-driven decision. Significant changes to the space, the load pattern, the control or conditioning system, or the surrounding environment can move the worst-case locations and invalidate the original conclusions, which triggers a fresh study or a documented assessment of why the existing map still applies. Some programs also re-map on a periodic basis as a check against gradual drift. The logic mirrors the broader question of when qualified equipment needs re-qualification, covered in revalidation: when to redo IQ, OQ, and PQ. The whole strategy, from which spaces get mapped to how re-mapping is triggered, is the kind of thing that lives in a validation master plan so it is consistent across the site rather than reinvented for each room.
A defensible study, end to end
A mapping study that survives scrutiny reads as one continuous chain. The product needs a storage condition, the condition sets the acceptance criteria, the criteria drive where sensors go and how long they run, the sensors are calibrated before and verified after, the empty and loaded runs separate the equipment from the load, the open-door and power-loss studies convert the map into operating limits, seasonal data bounds the year for ambient-dependent spaces, and the worst-case locations become the permanent monitoring points. Every choice has a reason on the page next to it.
The version that draws findings is the one missing links: sensors placed for convenience, a duration with no rationale, a loaded study skipped, no recovery data, no seasonal coverage, and monitoring probes wherever the wiring was easiest. The difference between the two is not effort at the extremes but discipline in the connections. Map to find the worst case, prove the worst case holds, and point your monitoring where the study told you to.
Valiqa turns your storage claim, equipment, and risk assessment into audit-ready qualification protocols with traceable acceptance criteria. See how at valiqa.io.
Get new validation guides in your inbox
One or two practical guides a week, written for validation engineers. Unsubscribe anytime. Privacy policy
Frequently Asked Questions
Ready to automate your validation documentation?
Generate audit-ready IQ/OQ/PQ protocols in minutes, not weeks.
Get StartedWe use essential cookies for authentication and security. With your consent, we also use Microsoft Clarity, Google Analytics, and the LinkedIn Insight Tag on our marketing pages to understand how visitors navigate the site and to measure our advertising. Read our privacy policy.